Trusted bookkeeping software for accountants
99%+ AI accuracy that supports reliable, confident conversations.
Accounting automation that frees up time without losing control.
Bookkeeping tools that help you deliver more value, consistently.

No credit card required.

Bookkeeping without the hassle –
free up time for business


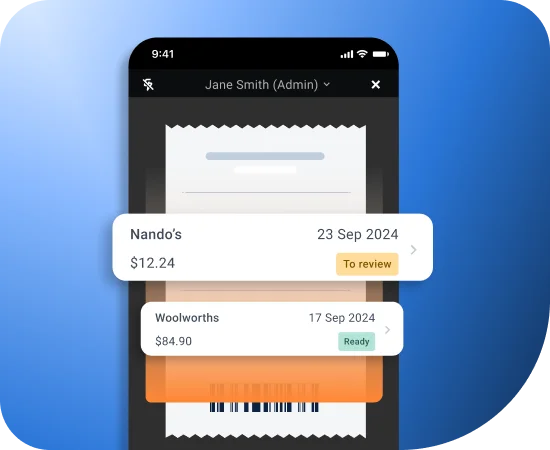
Easily capture everything you need
Dext automates how you get your clients’ bookkeeping records. You can submit via our mobile app, email or drag and drop directly onto our platform. We also integrate with over 11,500 financial institutions worldwide, as well as e-commerce platforms, payment providers and more. The result? Less friction, greater accuracy, and more time to add even more value to your clients.
Less manual work, more time for what matters
Dext automates the day-to-day bookkeeping tasks that slow you down — from data entry to categorisation and reconciliation. Capture documents instantly, reduce errors, and keep your books accurate without touching a spreadsheet. More automation. Fewer headaches.


Connect Dext
with your accounting software
Dext offers over 30 accounting software integrations and connects with over 11,500 banks and institutions. This means you can use Dext at the heart of your accounting and bookkeeping workflows without any worries.
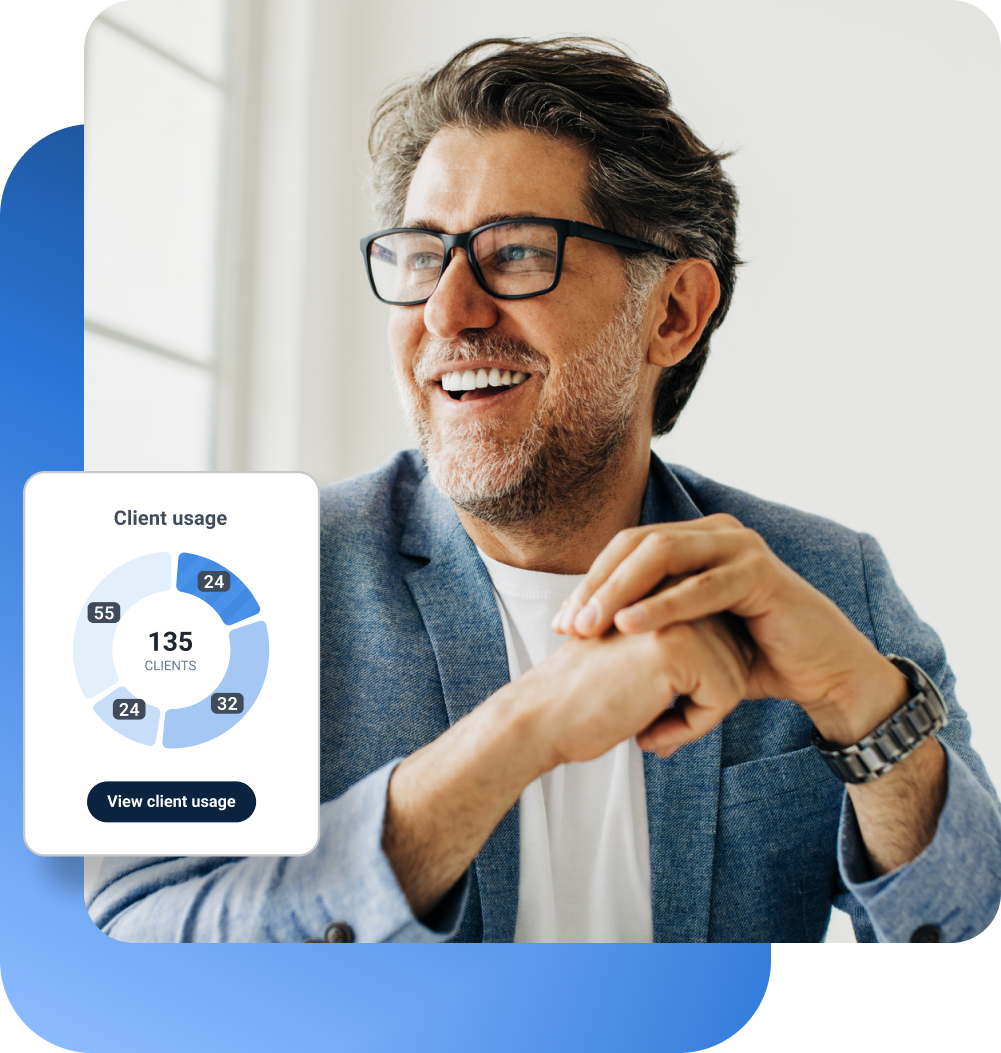
Make your team more productive
Get in-depth data into how clients are performing. Find opportunities to expand your practice’s capacity and introduce new services. Use workflow tools to speed up everyday work. And enable your people to help clients reach success.


Remove hassle at every step
- Capture
- Extract
- Automate
- Publish
- Check
Capture everything
Dext automates how you get your clients’ bookkeeping records. Submit via our mobile app, email or drag and drop directly onto our platform. Connect to over 11,500 financial institutions worldwide, as well as e-commerce platforms, payment providers and more. The result? Less friction, greater accuracy, and more time to add even more value to your clients.
Join thousands of businesses
already on Dext
We're proud to have helped thousands of accounting & bookkeeping firms and businesses better manage their processes, saving millions of hours of manual work.
Businesses globally
Accounting and bookkeeping firms
Business documents processed annually
Industry news, features and insights
Try Dext yourself with our 14-day free trial
Over 700,000 businesses and 12,000 bookkeeping and accounting firms worldwide use Dext to make more time for the things they do best. Click below to find out more.
FAQs
Dext is a platform that helps automate bookkeeping tasks by capturing, processing and organising financial documents. It uses AI to extract data from receipts, invoices and bank statements, reducing the need for manual entry. Dext integrates with most major accounting software and is used by both accountants and small businesses.
Key features include:
- Document capture and processing: Upload documents through the mobile app, email-in, or auto-fetch tools. Data is automatically extracted and prepared for review. Discover our mobile accounting and bookkeeping app
- Expense management: Submit and track expenses in real time, with automated data capture.
- Mileage tracking: Record travel and calculate mileage expenses directly within the platform.
- Approval workflows: Set up steps for reviewing and approving financial documents before they are published to the accounting software.
- Bank feed connections: Link to bank accounts to match transactions with documents and support account reconciliation.
- Client communication tools: Request documents, send reminders, and monitor submission status from one dashboard with our item messaging feature.
You can invite clients to join Dext and ask them to upload documents using the mobile app, email, or desktop, whatever works best. If your firm processes documents for your clients, that’s fine too. Dext is designed to suit all workflows, whether your clients are hands-on or your team handles everything.
Yes. Dext gives you a practice dashboard where you can view and manage all your client accounts from one place.
Dext connects with over 37 platforms, including major accounting software like Xero, QuickBooks Online, Sage, Zoho, and MYOB. It also works with e-commerce platforms like Amazon and Shopify, and automation tools like Zapier.
All partners have access to onboarding guidance, training resources, and help through our support channels. Depending on your plan, you may also have access to our dedicated partner team for more tailored support.
By automating admin and cutting down on manual tasks, Dext gives you more time, whether you want to take on more clients, focus on advisory services, or just have fewer late nights.
Yes! Our partner program offers discounts, early access to features and more. It’s designed to help firms grow efficiently and sustainably.
You can sign up online, and our team will help you set up your account, invite your clients, and get your team up to speed.
We offer live sessions, on-demand videos, and a full help center. Whether you're just starting out or training new staff, we’ve got you covered.
Yes. Dext uses encrypted storage and follows best practices for security and compliance. We’re GDPR and ISO certified, so your clients' data is always protected.